Camphill Village Trust

Edit and design of charity’s impact report

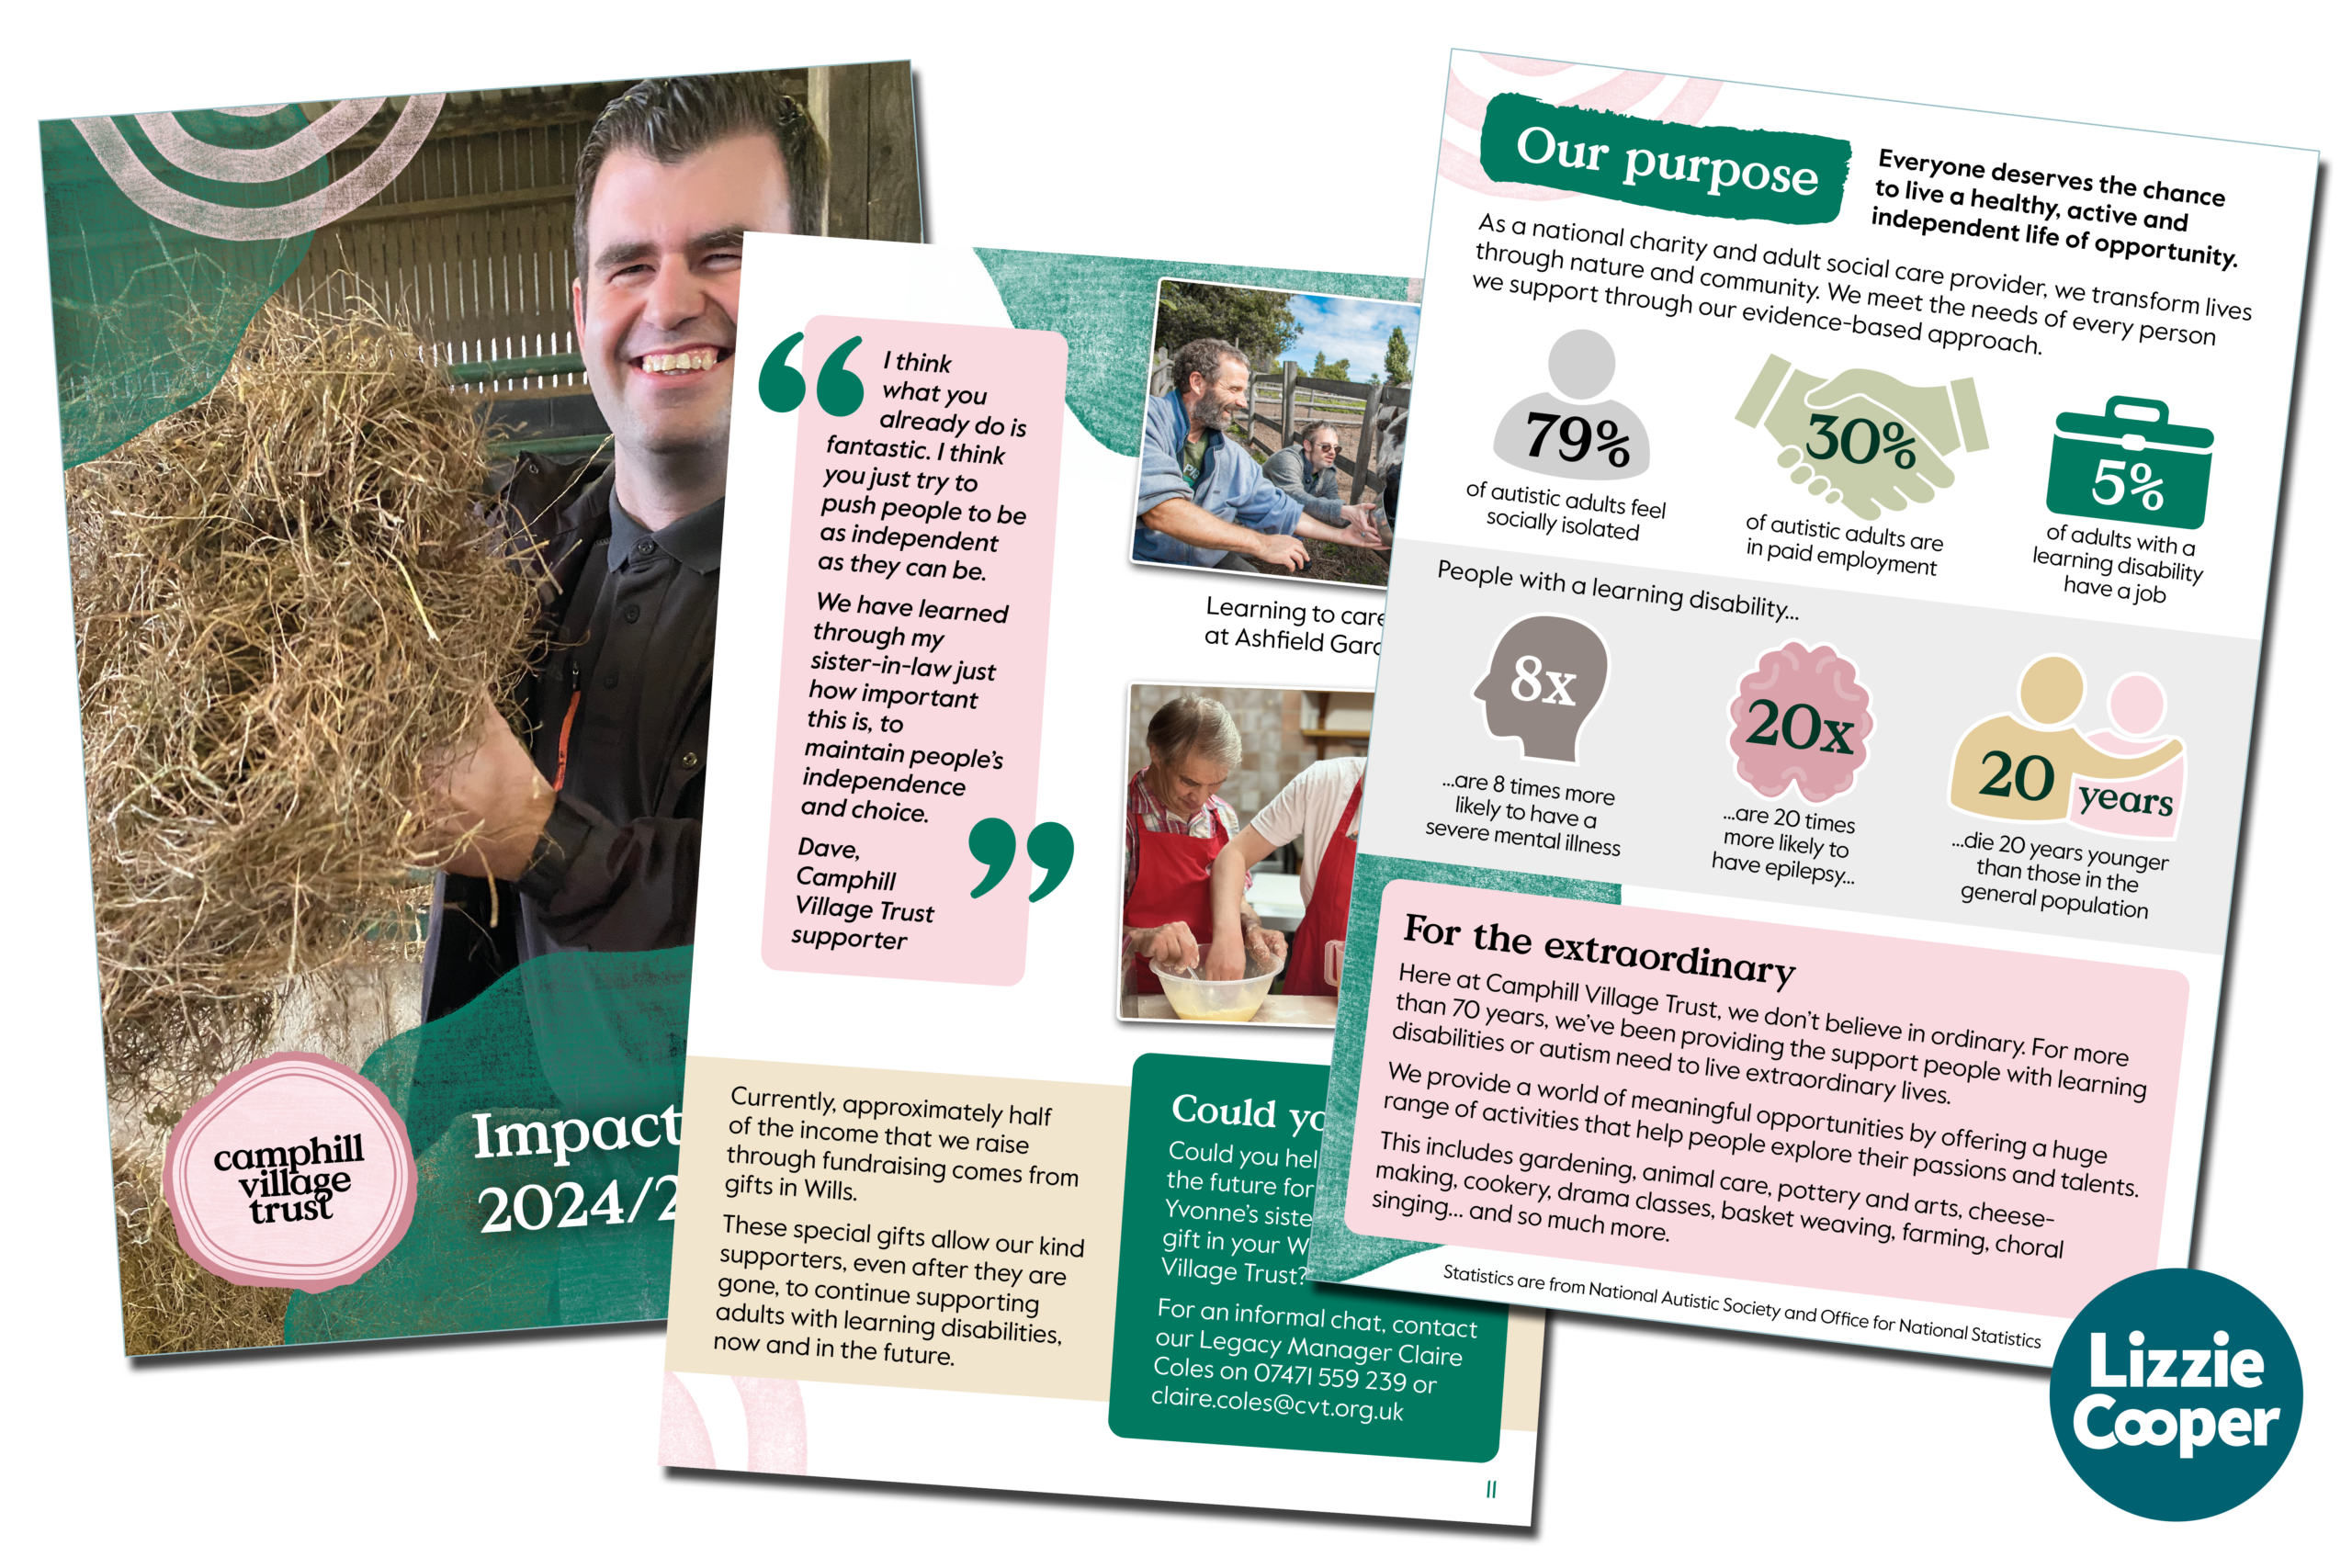
Three pages from the Camphill Village Trust annual report 2024 - 25

The challenge

Camphill Village Trust needed to create their first ever impact report to share with their supporters, including major donors, regular givers, volunteers and businesses.

The brief was for a visually-appealing report which fit the brand of Camphill Village Trust, and which would appeal to their varied audiences.

The charity provided copy, photographs and a series of statistics to be turned into infographics. They also supplied another charity’s impact report as design inspiration.

The process

As always, I began by clarifying the brief, looking at recent publications by the charity, and learning about their values, mission and impact.

I proofread and edited the copy, advised on structural changes, made editorial suggestions and reworded copy with plain language and accessibility in mind.

Once copy was approved by the charity, I designed the first draft to meet the requirements of their brand guidelines, recent artwork which showed how the brand had developed recently, and the impact report they wanted to emulate. After two sets of revisions, the report was signed off.
The solution

The final report brought to life the impact the charity has on hundreds of people’s lives. It showcased stories of the people they support, with infographics highlighting why the charity’s work is so important.

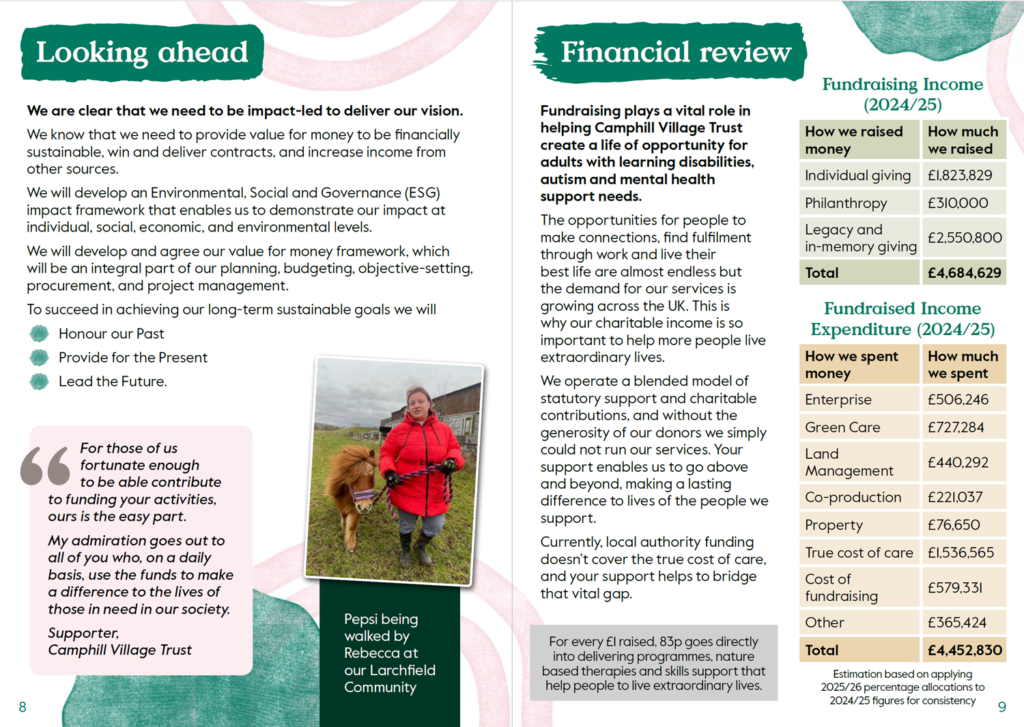
Financial information was easy to read, and the photos and quotes throughout told a story of people being supported to live extraordinary lives.

I provided both a print-ready PDF and an accessible digital PDF.

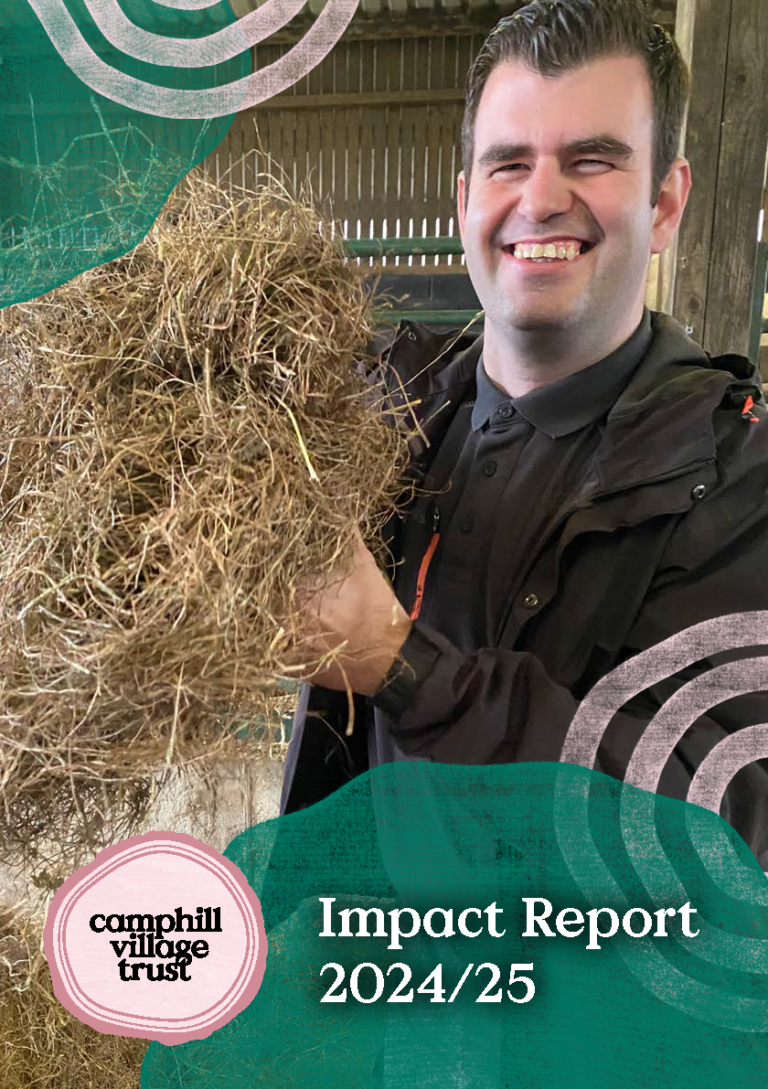
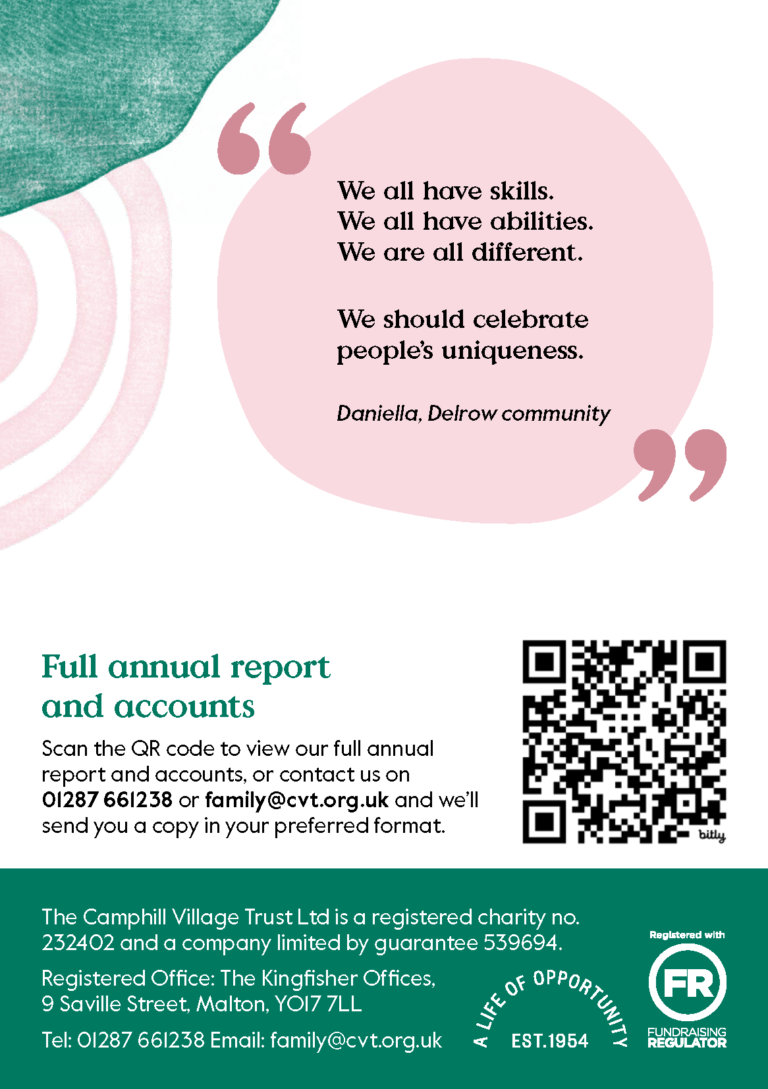
The front and back pages of the report:

Front page showing a man in a barn holding up a bundle of hay and grinning at the camera.
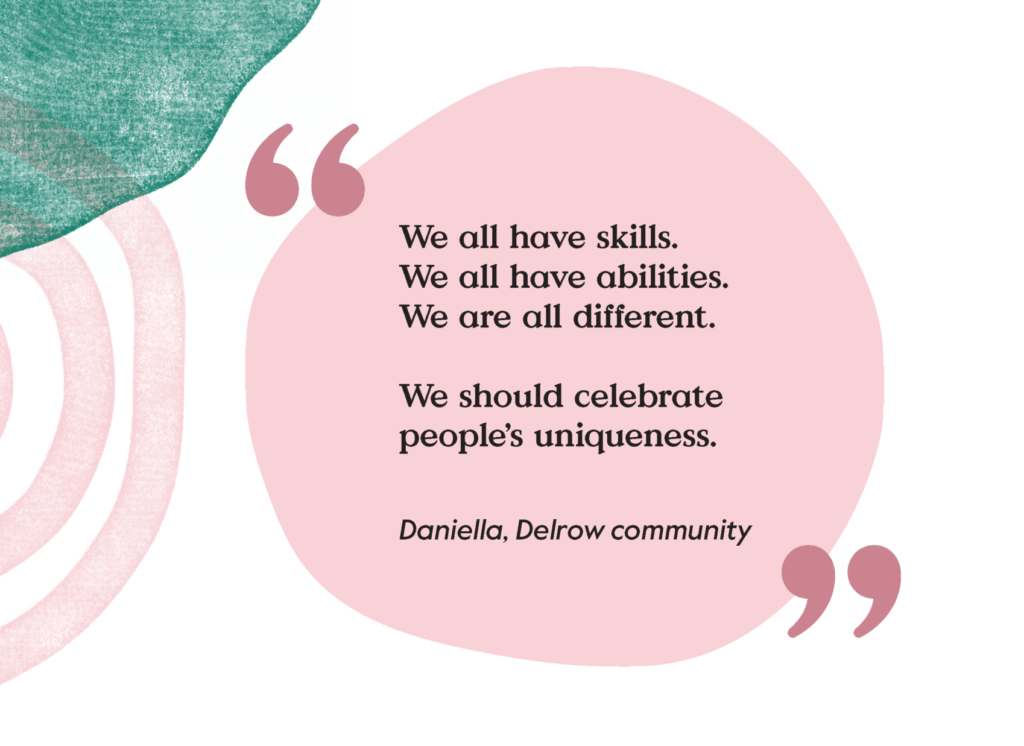
Quote from Daniella from the Delrow community, saying we all have skills, we all have abilities, we are all different. We should celebrate people’s uniqueness.

The impact

The project manager at Camphill Village Trust said that the report “exceeded expectations” and has been well received by their 16,000 supporters. It is being used to report on the charity’s impact and to support future fundraising campaigns.

Design details

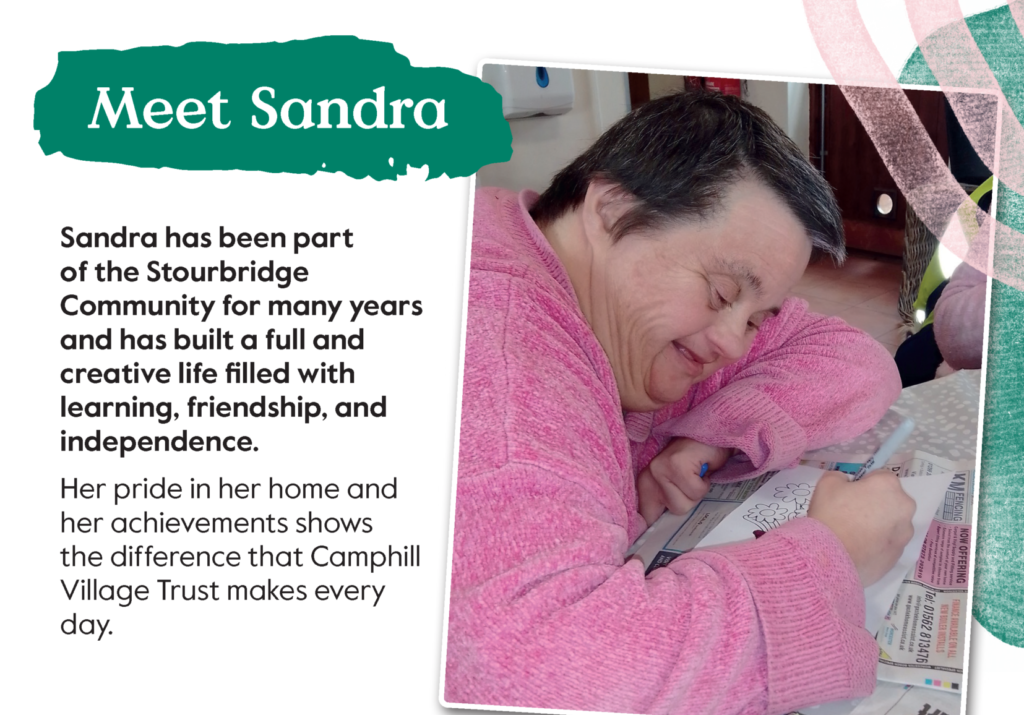
Prominent photos tell the story:

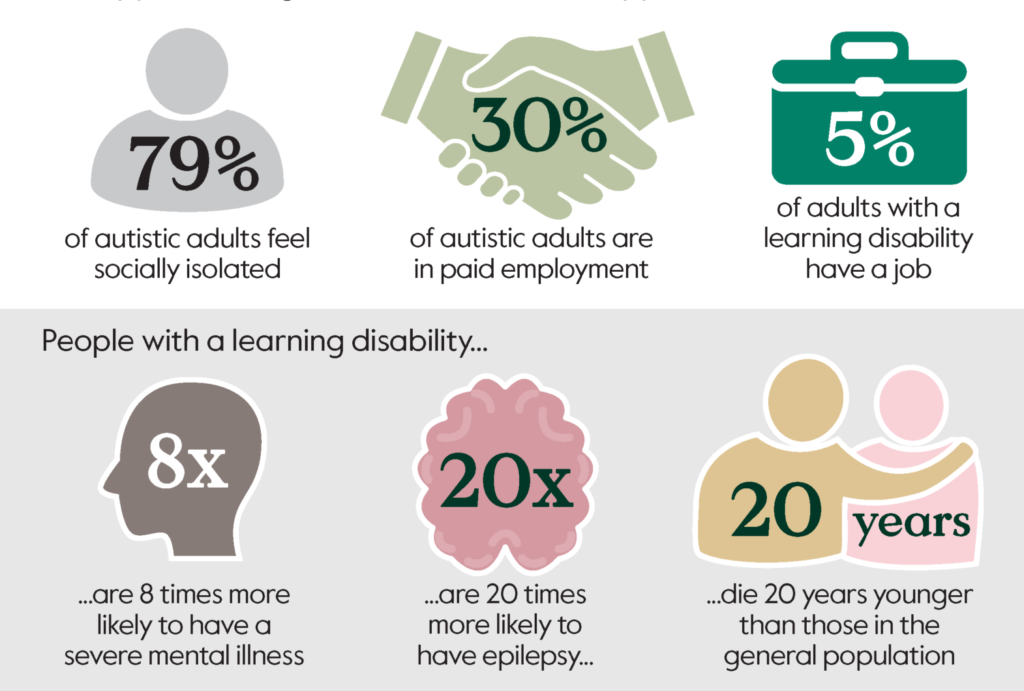
Infographics pull out key data:

Infographic. 79% of autistic adults feel socially isolated. 30% of autistic adults are in paid employment. 5% of adults with a learning disability have a job. People with a learning disability are 8 times more likely to have a severe mental illness, 20 times more likely to have epilepsy, and will die 20 years younger than those in the general population.

Pull quotes from the people who say it best:

Quote from Daniella from the Delrow community, saying we all have skills, we all have abilities, we are all different. We should celebrate people’s uniqueness.

Visually appealing design set up for print and for digital accessibility:

Double page from the report showing financial info